Printer Friendly (PDF)
Most heating and cooling pumps in commercial buildings operate in a variable speed mode. Today, we take your Monday Morning Minutes to explore the variable speed pump curve, see what is on it, and understand how it differs from a constant speed pump curve. Keep an eye out for the two key points of reduced horsepower use and better efficiency.
Let’s start this blog with a clear thought: A variable speed pump curve is just several constant speed pump curves shown together. There are slight differences which I will mention in later paragraphs.
Constant Speed Pump Curve Review
In our blog, What’s On a Pump Curve?, we identified the parts of a constant speed pump curve. You may want to review that if you missed it or need a refresher. In our blog, Closed System Curves in HVAC Hydronic Systems, we introduced the system curve and used an example pump of 100 GPM at 100 feet of head. The 100 at 100 point could represent a selection of 100% flow at 100% head. We used the Bell & Gossett ESP-Systemwize selection program to find an inline pump with these capacities. Here is our example pump curve from that article.
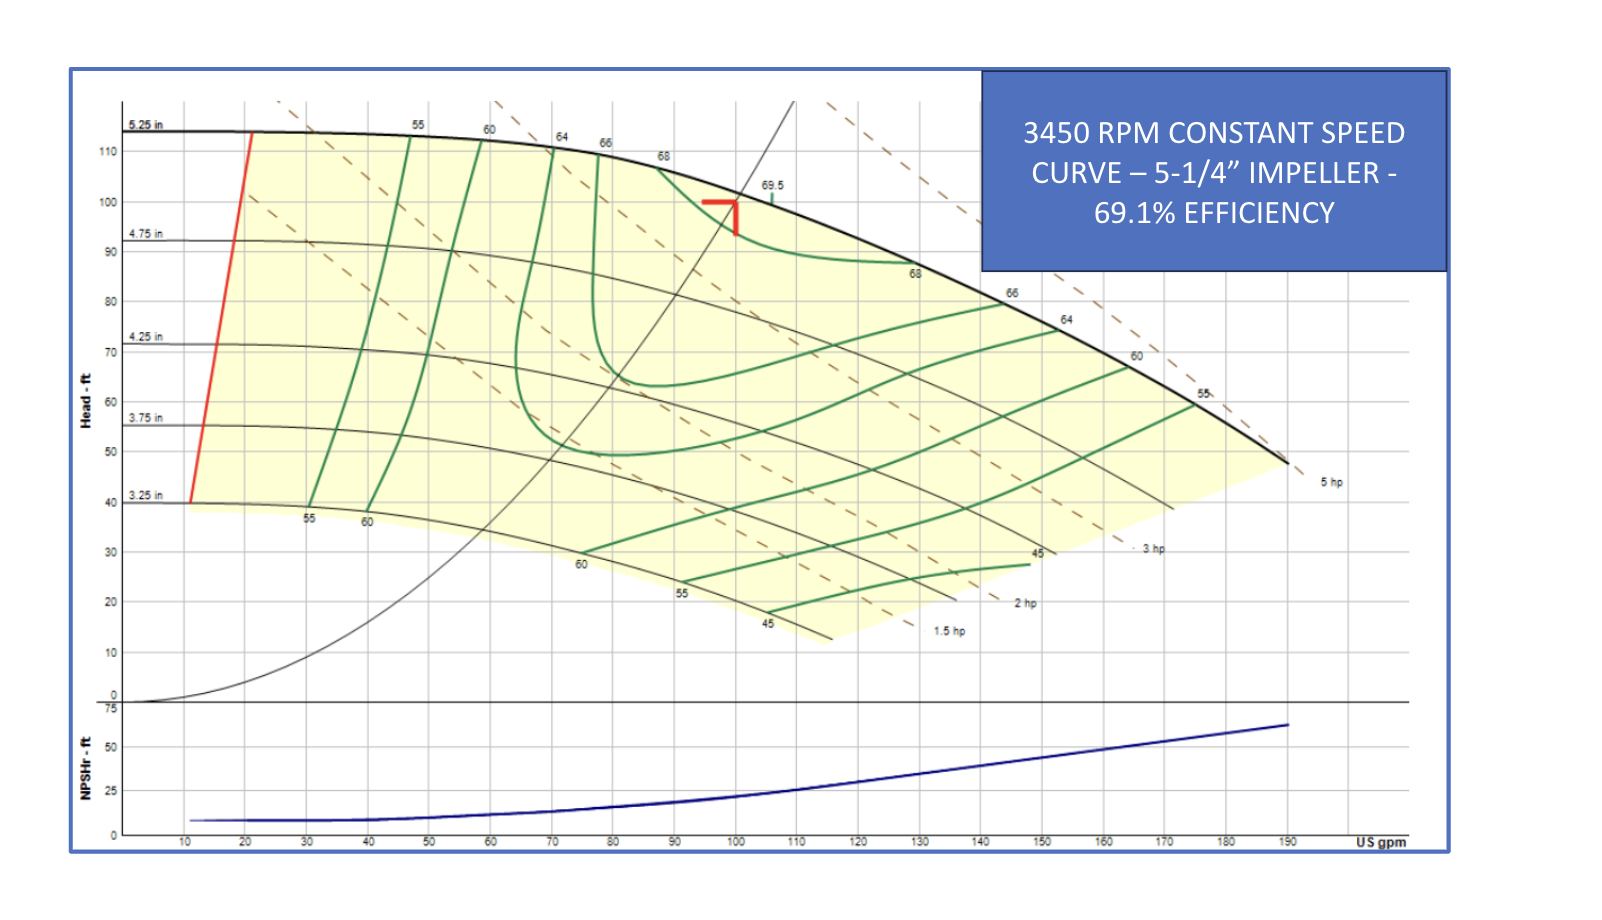
Note the speed, impeller size, and efficiency. What happens if we select the same pump at a different speed?
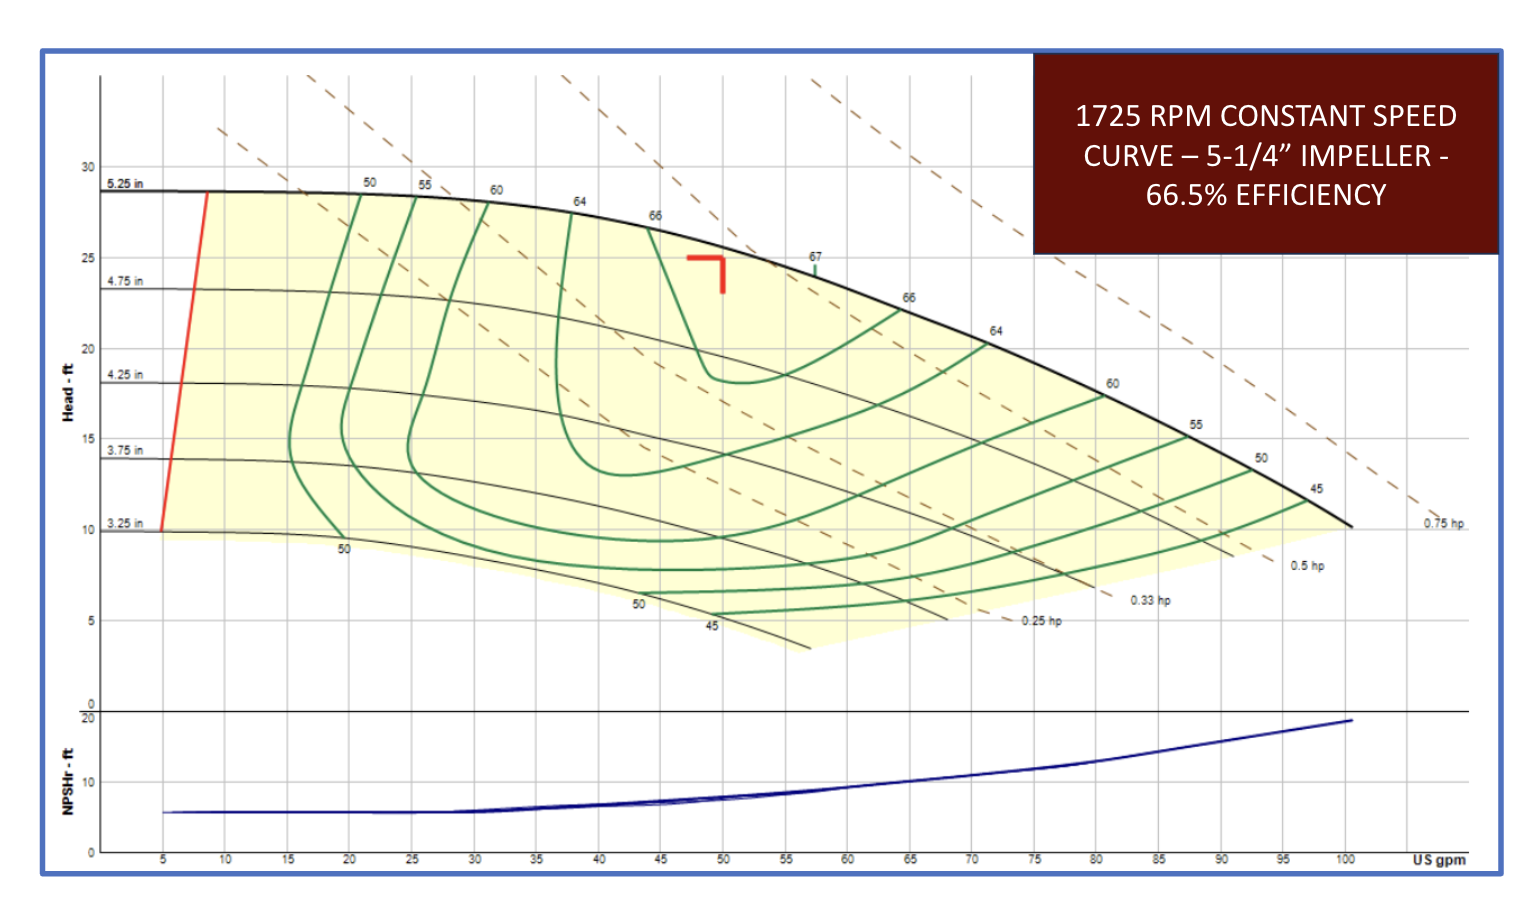
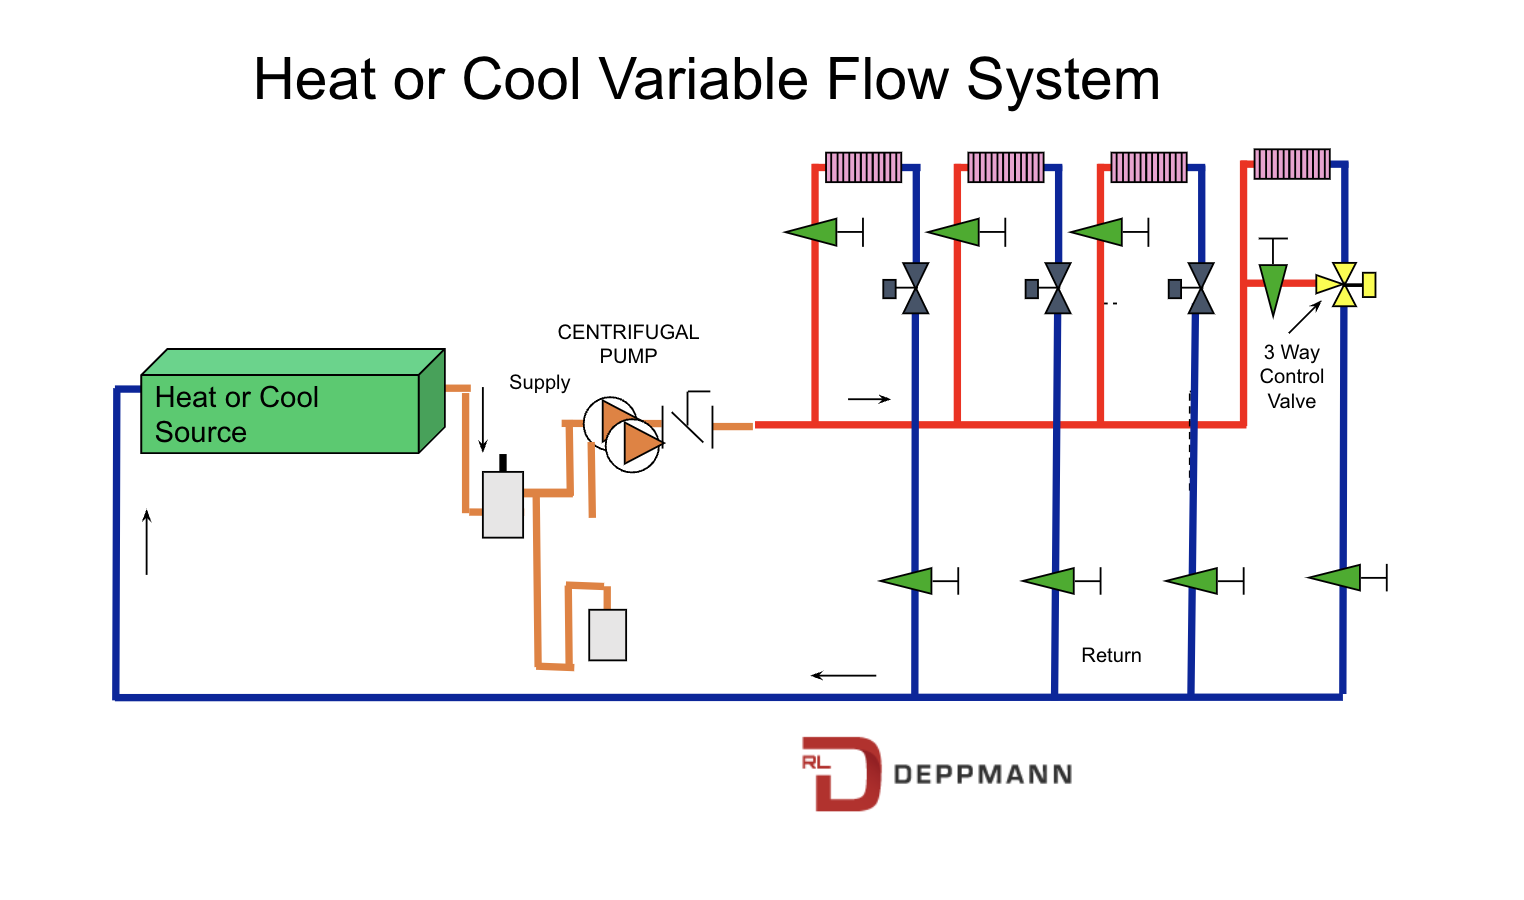
This is the same B&G inline pump with the same impeller size. We just put a 1725 RPM motor on it instead of a 3450 RPM motor. I marked an operation point of 50 GPM at 25 feet of head to get a point about the same place as the 3450 RPM curve. Did you review the Closed System Curves in HVAC Hydronic Systems blog mentioned above? We are going to use that right now.
System Curves and Pump Affinity Laws
In the blog mentioned above, we discussed the second affinity law. Given a system with the control valves wide open or in a steady state condition, if you try to move half of the water flow rate, it will take a quarter of the pump head. Our example is a flow rate of 100 GPM at 100 feet of head at design. The second pump affinity law says if I need 50 GPM, the pump head required would be 25 feet. WHAT A SURPRISE! THAT’S THE CAPACITY I SELECTED ABOVE.
The First Pump Affinity Law
The first pump affinity law says the flow varies proportionally with the impeller diameter in a constant speed world. It also says the flow varies proportionally with the speed in a variable speed world.
GPM1/GPM2 = IMPELLER SIZE1/IMPELLER SIZE 2 = SPEED1/SPEED2
Look at those two curves above and look at this formula.
100 GPM/50 GPM = 3450 RPM/1725 RPM
Wow, the formula works. Look at the 3450 RPM curve and the impeller lines. The system curve goes through a point of 50 GPM at 25 feet. Of course, it does. That is the second affinity law. Imagine if there was an impeller line through that point. What size would it be? It would be about this size.
100 GPM/50 GPM = 5.25/2.625
The flow rate varies proportionally with the impeller size. A variable speed pump curve looks just like a constant speed pump curve, but the impeller lines are replaced with speed lines. Wow, we finally got there.
The Variable Speed Pump Curve
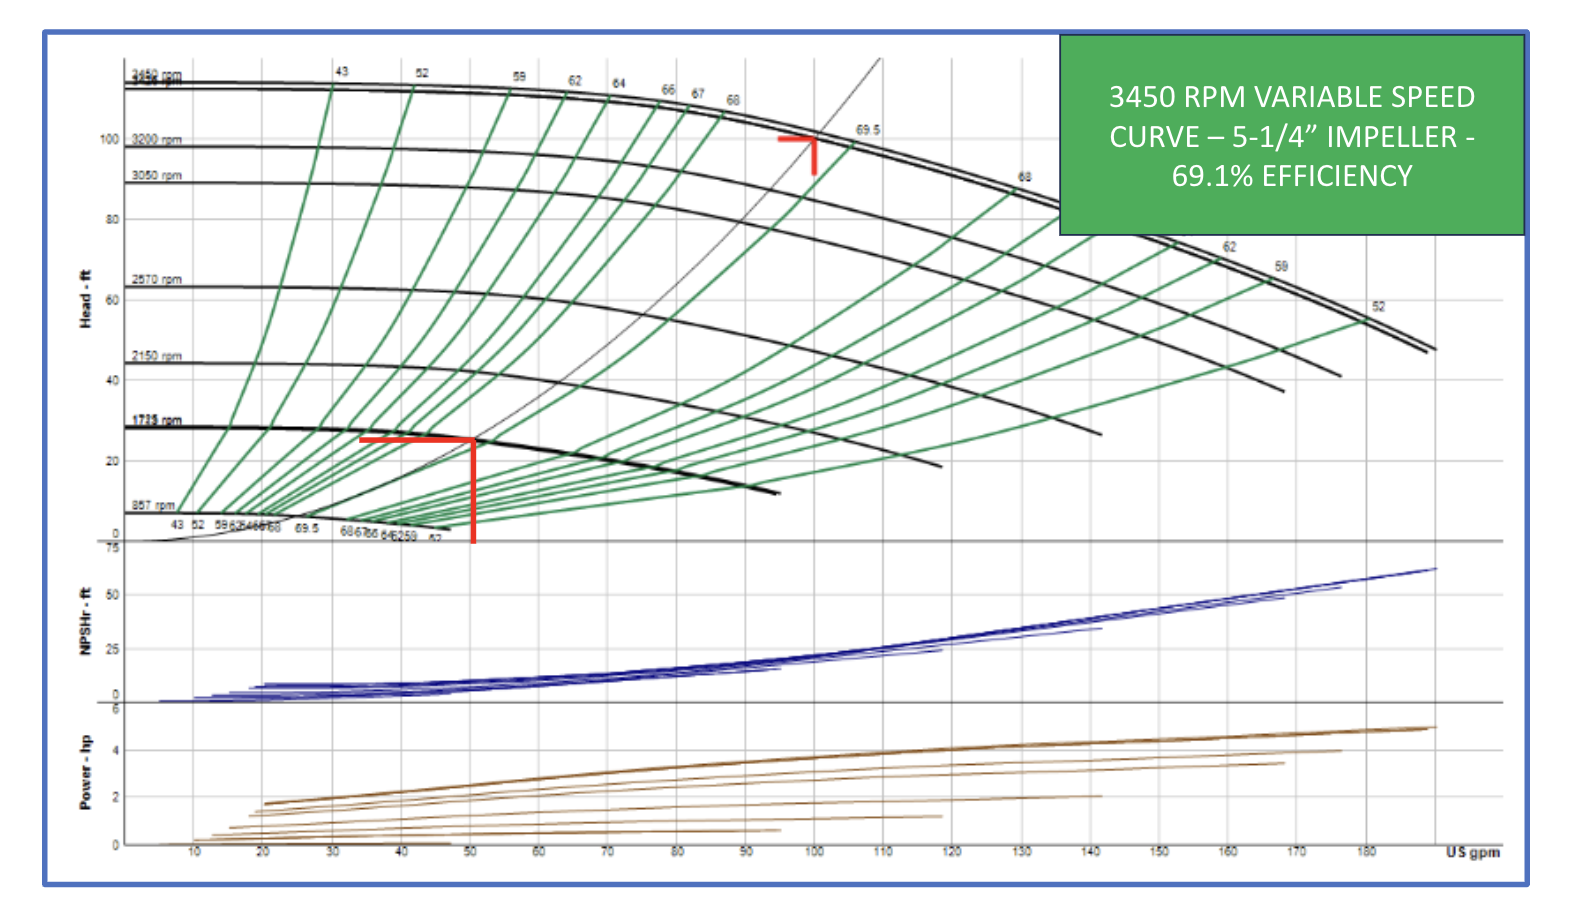
Here is a variable speed pump curve for the same 100 GPM at 100 feet of head selection. The lines that look like the impeller lines are the different speeds. I identified the 3450 RPM design point and the 1725 RPM 50% flow points on the curve. Both points are on the theoretical system curve as previously mentioned.
Look at the horsepower lines shown below the pump curve. They are not on the pump curve because there would be so much data the curve would be difficult to read. We will zoom in on the portion of the curve with the 1725 RPM data point. Of course, if you use the Bell & Gossett ESP-Systemwize selection program, you could download a report with this information.
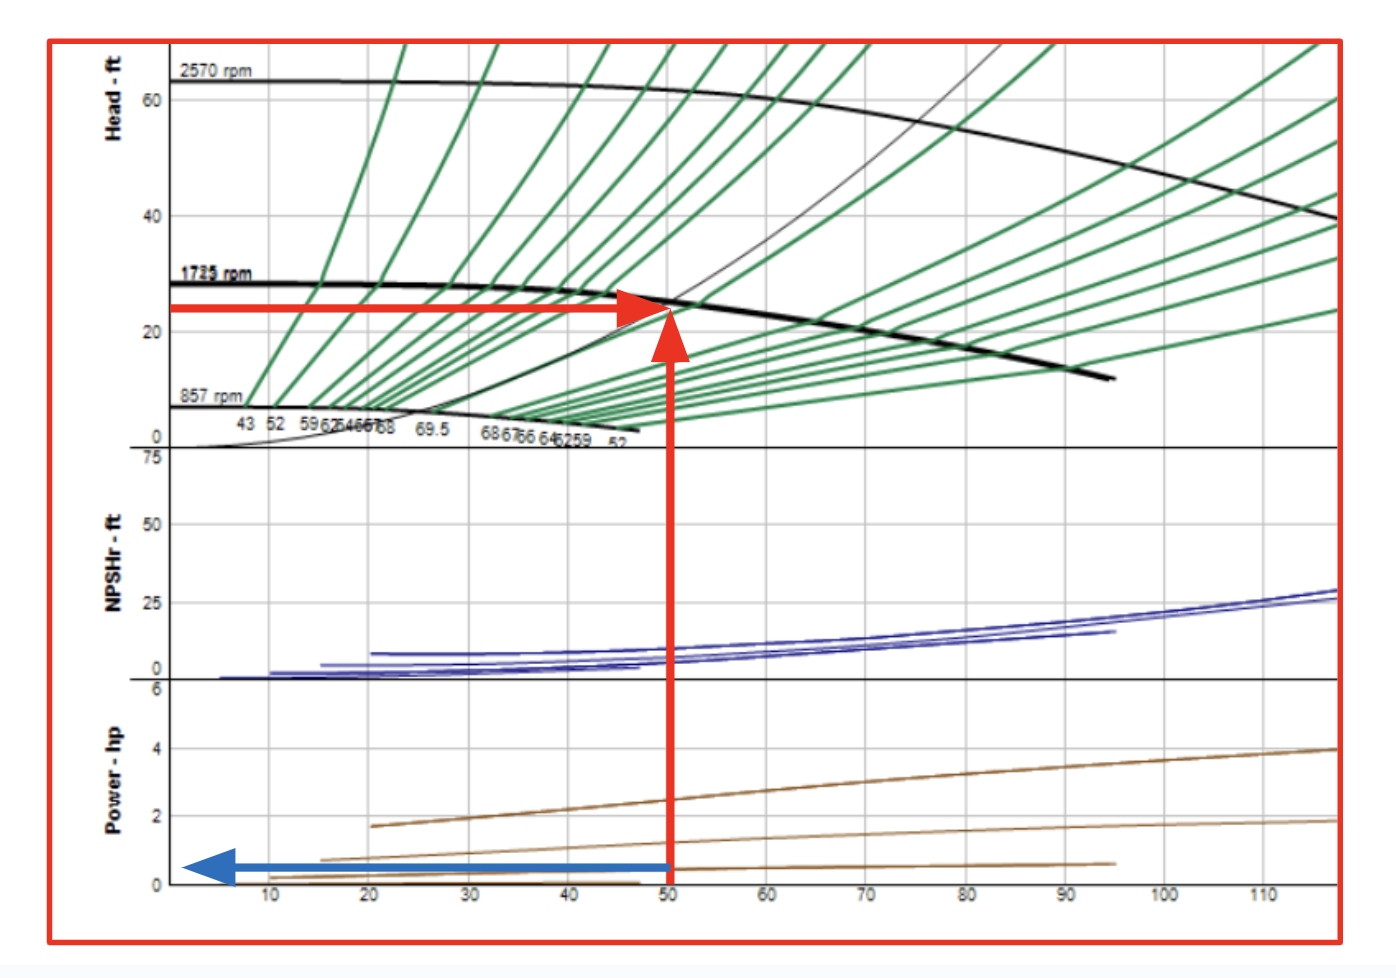
The blue line shows the horsepower on the speed shown at less than ½ HP. If you look at the Three-way & Two-way Control Valve Basics in Hydronic Systems from last week, you will notice the horsepower used with 2-way valves throttled at 50% flow rate was less than 2-1/2 HP. The use of variable speed to reduce the flow rate saves over 2 HP. This is why it is the energy saving standard for HVAC hydronic systems in State and Federal codes.
Constant Efficiency Lines
There is one difference of importance on the variable speed curve versus the constant speed curve. Look at the two constant speed curves shown above. The maximum efficiency of the 1725 RPM curve is 67%. The maximum efficiency of the 3450 RPM curve is 69.5%. The duty point efficiencies are on the curve. The efficiency of the 1725 50% flow point is 66.5%.
Now look at the variable speed curve at the 50% flow point at 1725 RPM. The efficiency at that point is 69.1%. Operating a pump at a speed lower than the motor nameplate speed will give a better efficiency than using a lower speed pump or trimming the impeller. Notice the green lines that look like the system curve. These are constant efficiency lines.
Increasing the speed of a pump introduces more motor and pump noise. The engineer should review the advantages of the higher efficiencies vs. the effect of additional noise. Read our How to Pick an HVAC Centrifugal Pump: Motors for HVAC Centrifugal Pumps for additional information.
Today we looked at variable speed pump curves and their energy saving advantages. Next week we will look at the motors and variable frequency drives that vary the speed of these pumps.