Printer Friendly (PDF)
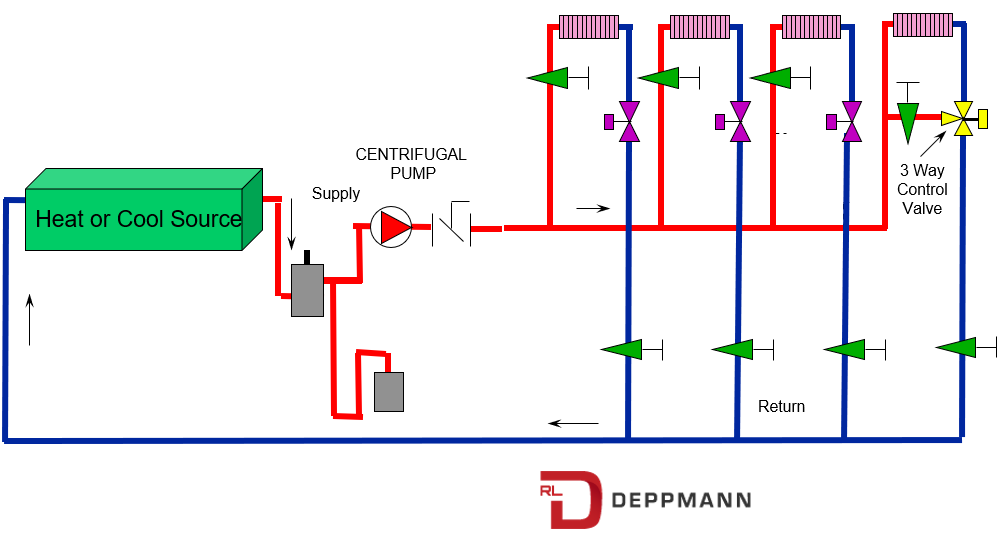
A system curve is a graphical representation of how a heating or cooling system flow rate and system head might change as the load requirement changes. A two-way control valve in a heating or cooling system will throttle to reduce the needed flow rate in response to a drop in load. System curves are key when we are selecting or analyzing the expected operation of centrifugal pumps as flow rates change. Once we superimpose this curve on the pump curve, we can tell a lot about the expected operating point.
How Does Pressure Drop Change as Flow Rate Changes?
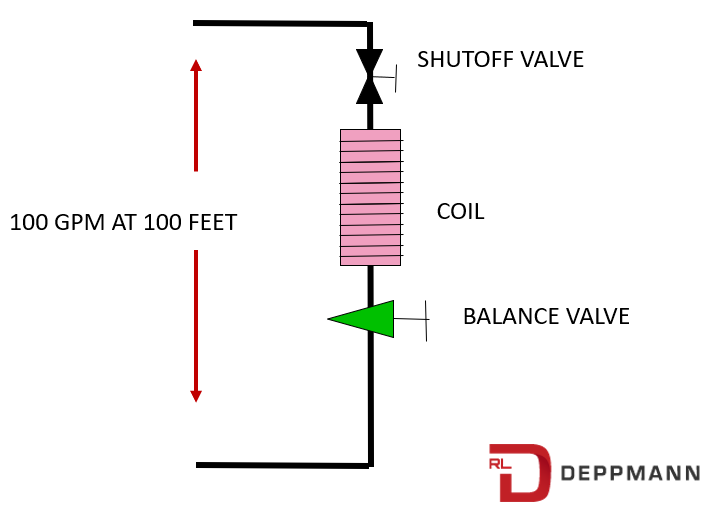 Look at the simple system shown here. At design, we will be at 100% flow which we show as 100 GPM. The circuit head required at this flow rate is 100% which we will call 100 feet.
We know this coil will have 100 GPM at 100 feet pressure drop at design. What if the control valve completely closes? Now we have a 0 GPM flow rate, and we will require no pump head to produce 0 GPM.
What if the outdoor temperature changes and we only need 50% of the flow rate or 50 GPM. What pressure drop will the circuit have at 50% of the design flow rate? A quick answer may be 50%, but that would be wrong.
The pressure drop varies as the square of the flow. If you have twice the flow through something, you have four times the pressure drop. If you have half of the flow, you have a quarter of the pressure drop. The relationship between the flow rate and the pressure drop is as follows:
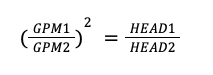
Using this, what would be the pressure drop required at a third of the flow rate? A third squared is a ninth. If we use this formula for various percentages of flow, we get the following.
| FLOW RATE | 100 | 90 | 80 | 70 | 60 | 50 | 40 | 30 | 20 | 10 | 0 |
| PRESSURE DROP | 100 | 81 | 64 | 49 | 36 | 25 | 16 | 9 | 4 | 1 | 0 |
Read our The Bell and Gossett System Syzer and Pump Affinity Laws for more about affinity laws.
Closed System Curves and Pump Curves
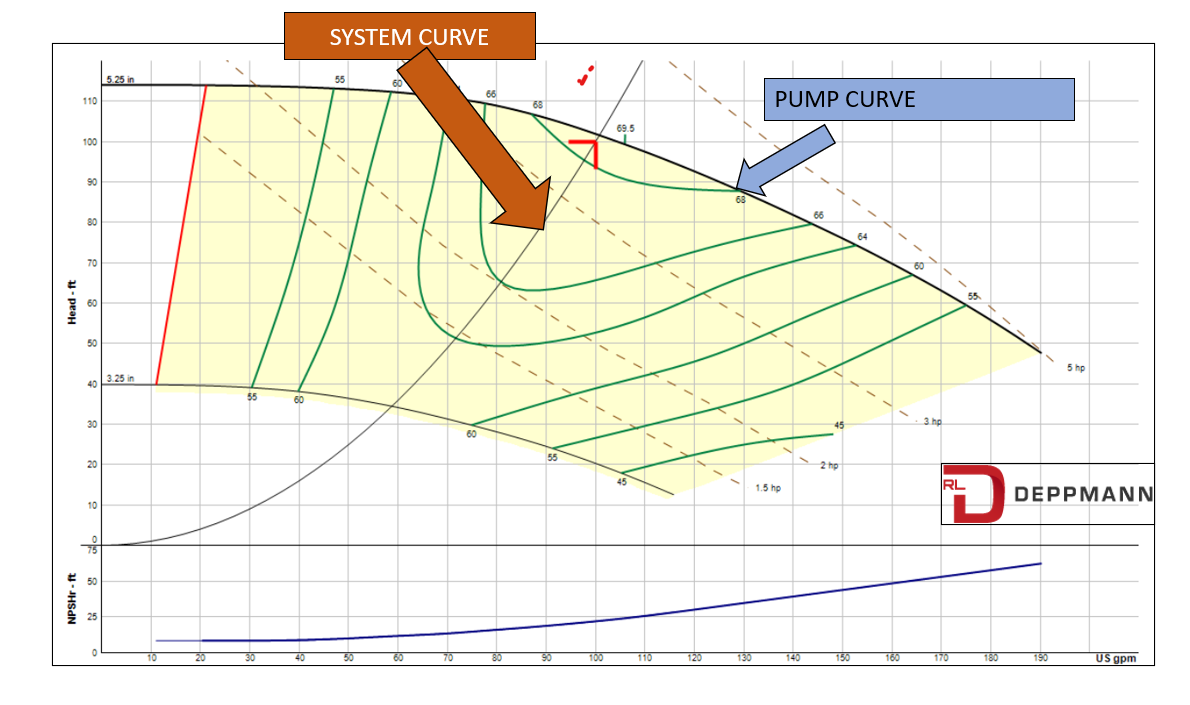
Here is a pump with a 3450 RPM 5 HP motor and a 5-1/4-inch impeller. Last week in What’s On a Pump Curve? we explained what was on the pump curve. The operating point is right between the 5 HP and 3 HP dotted lines. This pump at full flow of 100% or 100 GPM would require about a 4 HP motor if that existed.
The system curve is shown with the simple capacity numbers of 100 GPM at 100 feet. All the control valves are wide open, and the system is balanced to the design flow rate.
THE PUMP WILL OPERATE AT THE INTERSECTION OF THE PUMP CURVE AND THE SYSTEM CURVE.
Next week we will look at system curves moving in a dynamic operating two-way valve-controlled closed system.