Printer Friendly (PDF)
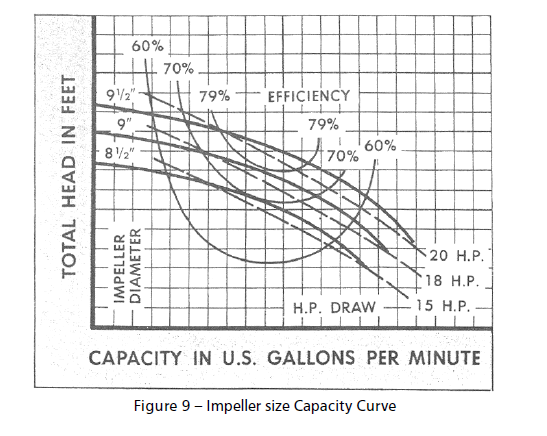
Image Credit: Xylem
Selecting centrifugal pumps for heating, cooling, process, and plumbing systems is easy once you understand how they work and what you are seeing when making those selections. The first step is to understand what information the manufacturer provided to you on the pump curve. That is the topic of today’s R. L. Deppmann Monday Morning Minutes.
Rate of Flow: Gallons Per Minute
The obvious reason the engineer needs a pump is to produce a pressure differential and provide a given flow rate with pumping across that differential. The flow rate is expressed in GPM, or gallons per minute. It may also be expressed as cubic meters per hour, or m3/hr. GPM is located on the “X” axis of the pump curve.
The flow rate at design is determined by the engineer. Unless it is a continuous constant load process, the flow rate will vary once it is in operation. The engineer should understand the minimum flow rate expected and the maximum flow expected as well as the design flow rate. We will address this more in a later R. L. Deppmann Monday Morning Minutes.
Friction Loss and Life: Feet of Head and Why Not PSI?
Image Credit: Xylem
A centrifugal pump uses centrifugal force to develop a pressure differential from the inlet or “eye” of the impeller to the outlet of the pump. Visit our blog, Centrifugal Pumps: How Do They Work?, for more information on how the pump works. The differential is in feet of head and is located on the “Y” axis. The developed head pressure may overcome friction loss in a closed hydronic, plumbing, or process system. The developed head may also lift water in an open system such as a building plumbing service water system.
Why Does the Pump Curve Express the Pressure Differential in Feet Instead of PSI?
The title above is a common question. The pressure gauges in a heating or cooling system are in PSIG. The inlet pressure required in a plumbing system fixture is expressed in PSIG. The welder cooling system in an automotive plant is expressed in PSIG. Why do pump manufacturers use feet of head instead of PSI?
The “feet of head” on the pump curve is an energy term expressed as foot-pounds per pound. Mathematically the pounds cancel each other, and we are left with feet. Xylem, parent of Bell & Gossett, speaks to this in their white paper, How to read a pump performance curve.
The issue caused if PSI was on a pump curve is a big one. We all understand that 1 PSI of pressure will lift water at room temperature about 2.31 feet. Another way to say this is that 0.43 PSI will lift water one foot. It would be a simple matter to turn the feet on the pump curve to PSI for water at room temperature. What happens if the water is at 240⁰F? What happens if the water is at 34⁰F? The 2.31 number changes. What happens if you are pumping molasses? It would take 0.62 PSI to lift molasses the same one foot. We would require a different pump curve for various fluids and even fluids at different temperatures. On the other hand, a foot of water and a foot of molasses are both still one foot. The engineer corrects the “feet of head” requirement of the pump when doing the calculations for a project. Then select the pump.
Impeller Curves
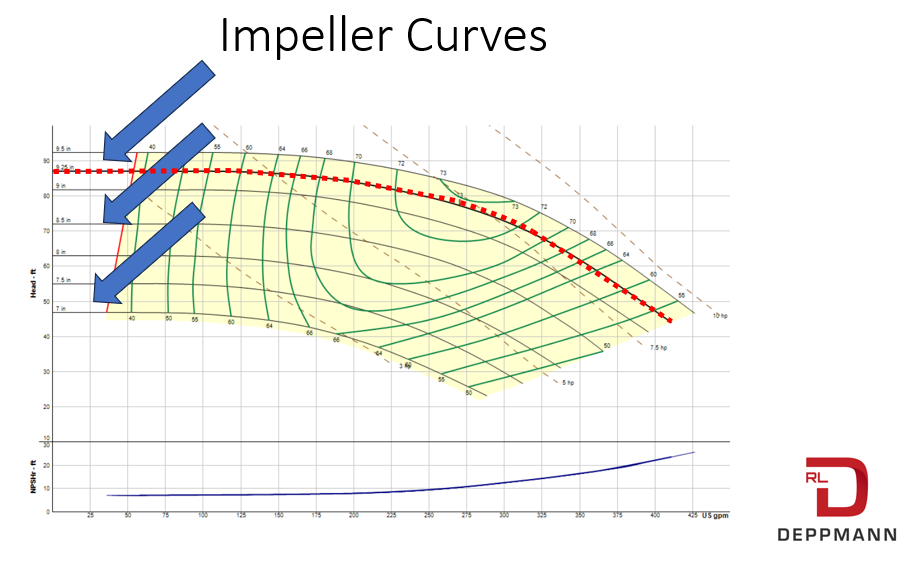
When selecting a basic pump, we take the required flow and the required head and draw lines to an intersection. Read the Xylem paper linked above for more detail on this selection basic. Where they intersect is the impeller size in the pump. Impellers are provided at different diameters for most pump models.
Look at the pump curve above taken from the Bell & Gossett ESP-Systemwize™ selection program. The curves going from left to right are impeller curves. The blue arrows show a few of the impellers. The dotted red line shows one curve for an impeller trimmed to 9-1/4”. Between the published minimum of 7” and the published maximum of 9-1/2”, this pump can normally trim at 1/8” increments. The manufacturer does not show all the curves for clarity’s sake.
This set of curves is for a pump at a single speed. We will address variable speed curves in a later blog.
Efficiency Curves
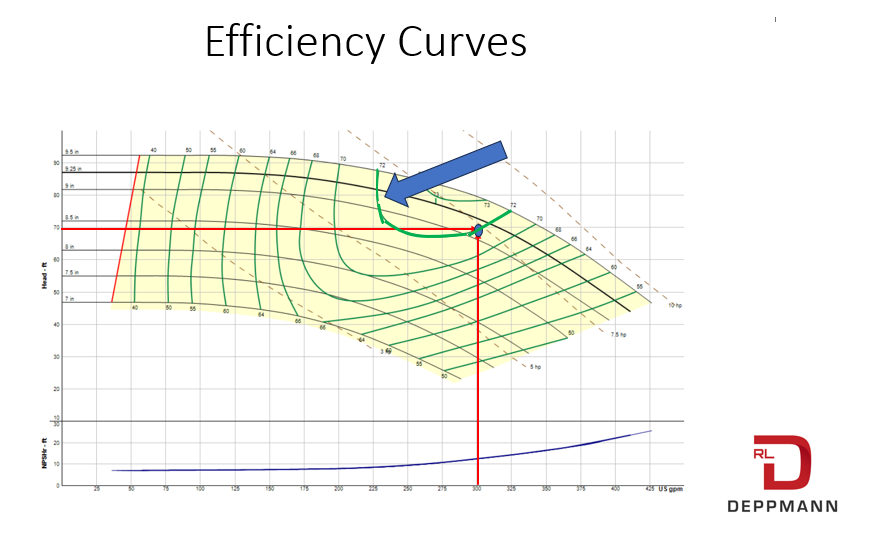
The next thing to look at is the efficiency curves. These are shown as green curves in this example. We selected 300 GPM at 70 feet of head. Using the process described in the Xylem white paper above, we put a dot where the 9-1/4” impeller trim would give us that capacity. That dot is on a green curve shown with an arrow. That efficiency is 72%. Efficiency is affected by many things. Let’s look at efficiency.
A pump can never be 100% efficient. The impeller is spinning in the pump, but you don’t hear metal-to-metal noises. There is a small gap between the impeller and the body, or volute. Water moved from the discharge back to the suction within the pump. That reduces efficiency because that flow rate is not leaving the pump. In last week’s article we talked about pressure drop from the inlet to the eye of the impeller. There is also a pressure drop from the tip of the impeller outlet to the pump discharge. These all reduce efficiency. That pressure drop is even more if the water must turn from the inlet to the impeller eye inside the pump. All these rotating pieces will create some heat which affects efficiency. You will find, in general, smaller pumps such as the curve above will have less efficiency than larger pumps. You will find inline pumps, like the curve above, will have less efficiency than end suction pumps. More on efficiency than you hoped to read about but keep it in mind when selecting pumps.
Horsepower Curves
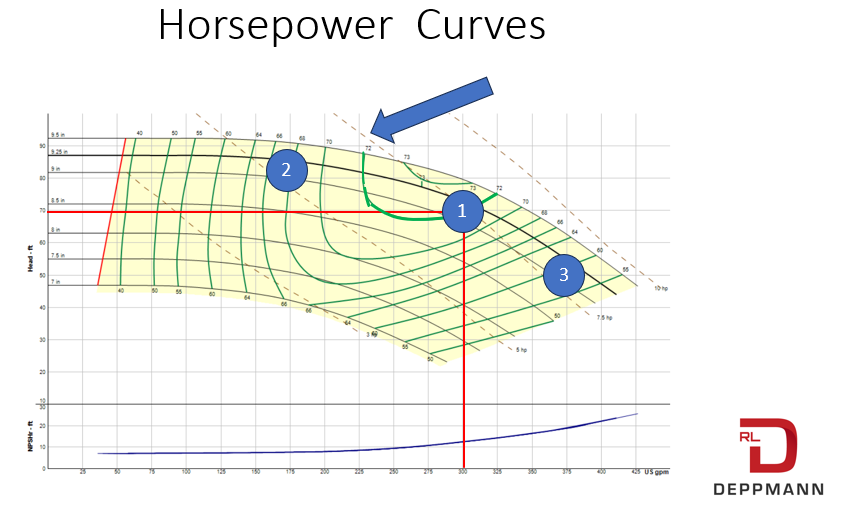
The dotted lines on the pump curve are the pump horsepower. This is known as “brake horsepower.” It is the horsepower required from the motor or driver to produce the requested flow rate and head. For our rated capacity of 300 GPM at 70 feet, point one, the example curve requires a 7-1/2 HP motor. If the two-way control valves in a cooling system throttle, the curve will move back on its curve to, for example, point two. This only requires 5 HP. If something happens in the system and we move out on the curve to 370 GPM, point three, we would need more than 7-1/2 HP. We would need a 10 HP motor. Specifying and providing a motor that will be large enough anywhere on the pump curve is referred to as a non-overloading motor. This selection requires a 10 HP motor to be called non-overloading and a 7-1/2 HP motor to be rated at the duty point.
There are three types of horsepower (HP) terms used in the industry. Input HP, Brake HP, Work HP are terms you may hear. Visit our blog Pumping System Efficiency and Energy for more information.
Net Positive Suction Head or NPSH Curve
The curve shown above at the bottom is the NPSH curve. NPSH is always important, but it is more critical at higher temperatures and lower inlet pressures. It would take Monday Morning “Hours” rather than “Minutes” to explain here. We will cover this in a later blog.
Pump Size and Speed
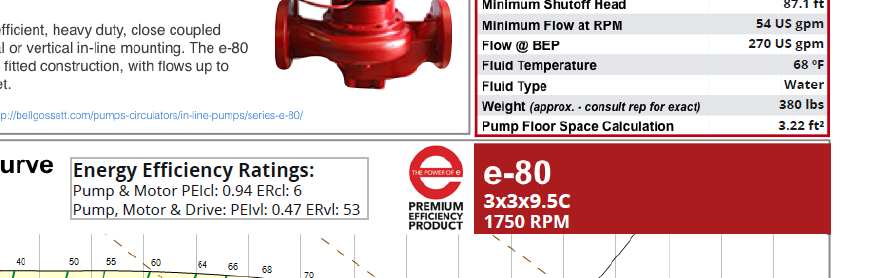
The last thing for today’s article is the pump information. It is on the published pump curve. We clipped a part of the submittal for the curves above. This shows a B&G model e80-3x3x9.5C at 1750 RPM. We purposely clipped pieces of other information in the screen show above. If you are wondering what these terms and numbers mean, WE ARE GLAD. Visit the ESP-Systemwize link and continue to read more of these R.L. Deppmann Monday Morning Minutes.