Printer Friendly (PDF)
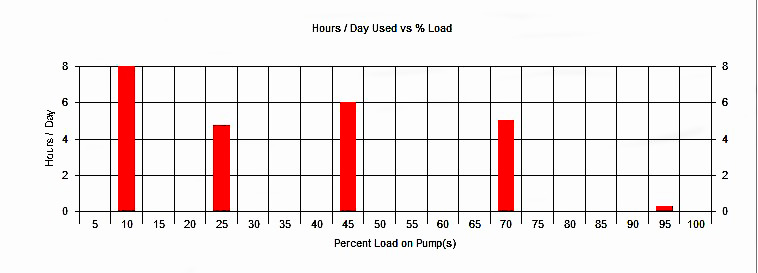
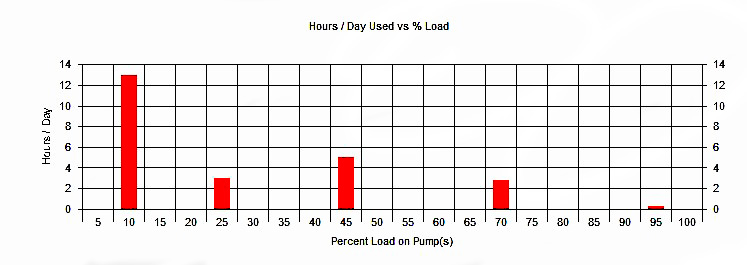
In last week’s Monday Morning Minutes (MMM) post, we looked at two different load profiles and introduced a capacity example with a range of variability in suction pressures.
The Example: 400 GPM at design serving an eight-story building.
The Question: Is there any advantage for the owner if we select a duplex 100%/100% design versus 50%/50%/50% for the number of pumps we use?
Let’s set up the system parameters that we’ll examine for an operating cost analysis:
- Pressures: Design pressure 98 PSIG and a minimum discharge pressure of 77 PSIG at 0 GPM with minimum suction pressures of 32 PSIG 30% of the time, 61 PSIG 30% of the time, and 45 PSIG 40% of the time.
- Flow distribution: Per the Bell and Gossett ESP-Plus pump selection programs.
When we run the B&G ESP-Plus selection program, some interesting results come out, which make sense if we go back to basics. But first, let’s share the results.
Result #1: Pressure booster energy savings
- Using a 50%/50%/50% B&G Technologic pressure booster in the university dorm profile resulted in a 9% energy savings over the 100%/100% system.
- Using a 50%/50%/50% B&G Technologic pressure booster in the hospital profile resulted in a 5% energy savings over the 100%/100% system.
NOTE: These may not sound like large numbers but over a 10 ten year span (the greater expected life of the pumping systems), it is significant.
Result #2: First cost analysis
The installed cost of any product varies with manufacturer, product value to the owner, specification, access, and labor costs. For this article, I compared two B&G Technologic pressure boosters with the same owner value built into the specification. In this example, there was only $670.00 difference in cost between the 100%/100% and the 50%/50%/50% products. In addition, the floor space required for the triplex unit was only 1.5 square feet more. Given a virtual identical cost, it makes sense to save your client the 5% to 9% energy savings and go with the triplex staged booster system.
As the client’s engineering representative, pricing decisions can get tricky. Lower priced and lower capacity “value-tier” pressure booster systems are available. In some commercial systems where your client has a short horizon of ownership, first cost tends to trump other benefits. For example, if we compare a benefit loaded, staged Technologic product with one of our lower tiered 100% standby products, these results change. However, in this cost analysis example of institutional owners, our experience is the higher value product is normally preferred and possibly even demanded by the client.
Result #3: Variable suction pressure makes a difference
When the suction pressure rises, the booster system is allowed to reduce speed. This starts to favor the 100% pumping system more than the 50%/50% system. In our example, the KW power used by the 100%/100% pumping system was 14% more than the 50%/50% system when the suction pressure was at the minimum. When the suction pressure was at its highest, the 100%/100% system power consumption was only 2% more.
Conclusions and rules of thumb
When doing a cost analysis of two pressure booster systems in the same pricing tier, the following generalizations may assist you in determining the number of pumps to use.
- In higher featured pressure boosters, always compare the costs of a 50%/50% staged pumping system with the 100% single operating pumping system. You may find that a triplex system at 50% each pump may be close in price to a 100% non-staged duplex system.
- You should ask if there is a lower tier or value tier product. Make sure you compare the prices and the benefits of the higher tier product and make sure your client will agree with the value and specification. This analysis will avoid owner questions when a “value engineering” lower tier product is offered during bidding.
- Rule of thumb: If the inlet suction pressure varies by less than 50% between lowest pressure and normal pressure, a 50%/50% system will be more energy efficient. In other words, if the suction pressure is fairly constant, a parallel system will be more energy efficient.
- Rule of thumb: If the minimum discharge pressure at low flow is less than 75% of the design maximum discharge pressure, a 50%/50% system will be more energy efficient. In other words, a tall narrow building with low friction losses favors a 50%/50% pumping arrangement, whereas a short wide building with a larger friction loss favors a 100% pump choice.
In next week’s MMM post, we’ll outline the reasoning for these statements.
Catch up on the entire series:
Part One: Capacity Sizing for Domestic Water Pressure Booster Systems
Part Two: Understanding Domestic Water Booster Systems and Discharge Pressure – Part 2
Part Three: Pump Options for Domestic Water Pressure Booster Systems Part 3
Part Four: A Comparison of Domestic Water Pressure Booster Systems Part 4