Printer Friendly (PDF)
Happy New Year! We hope that your 2016 is filled with good news personally, and a healthy business. In last week’s Monday Morning Minutes post, we introduced GPM split versus the number of pumps you might use in a pressure booster system. This week, let’s walk through a comparison of domestic water pressure booster systems from the real world.
Real-World Examples of Pressure Booster Systems
Context: University classroom building and a hospital building
Example capacity: 400 GPM at design in an eight-story building
First, let’s consider the suction and discharge conditions in the example, given the MMM from a previous post on capacity sizing for a domestic water pressure booster system.
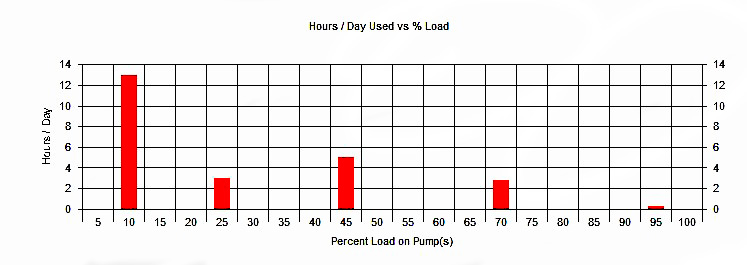
This is the load profile for the University Dorm Building plumbing system from the Bell and Gossett ESP-PLUS pump selection program. The system is at 100% of design flow rate for a minimal percentage of time. In fact, in the 24-hour daily operation, this building may only operate at 10% of the design flow over half of the time.
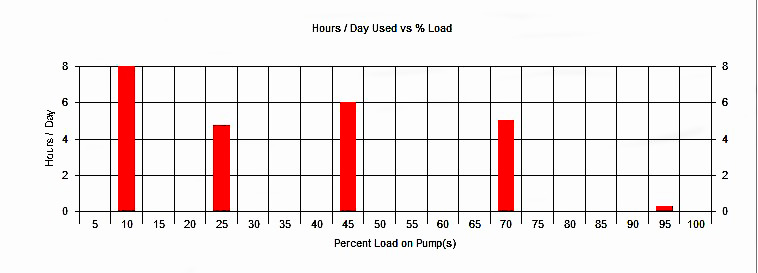
The hospital, with no laundry, has a completely different load profile. We still see very little time at 100% design capacity but the load is spread out significantly greater than shown in the dorm building. In this building, the pump is expected to run at 35% of demand flow rate half of the time.
Selecting Percent Load Per Pressure Booster Pump
The next step is to select the percent of load per pressure booster pump for each building. What should we choose if we need to be able to handle 100% of the load with one pump down? 100%-100%, or 50%-50%-50%? How do we go about checking operating costs?
We know the design capacities of the pressure booster are 400 GPM with a discharge pressure of 98 PSIG and a minimum suction pressure of 32 PSIG for a differential of 66 PSIG. When we look at costs of operation, the control head used on the pump curve will make a huge difference.
Understanding and Managing Costs of Operation
The control head for determining cost of operation is the minimum discharge pressure minus the no-flow suction pressure. This is the number we insert into the ESP-Plus program for the control curve and the operating costs.
If we locate the pressure sensor at the farthest or controlling fixture per ASHRAE standard 90.1-2013, the minimum discharge pressure without friction loss or safety factors will be 77 PSIG. If we ignore the 90.1 standard and put the sensor at the discharge of the booster system, the minimum discharge pressure will have to be set at the design discharge pressure. In our example, that would be 99 PSIG. For this example we’ll assume it is designed to the 90.1 standard.
In the quest for control head, we can take credit for the minimum suction pressure from the city water main which, in our example, is 32 PSIG. So the maximum control head is 77 – 32 = 45 PSIG.
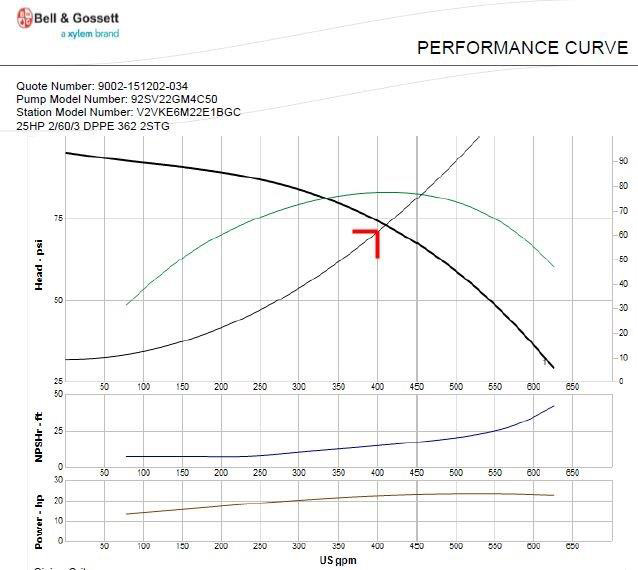
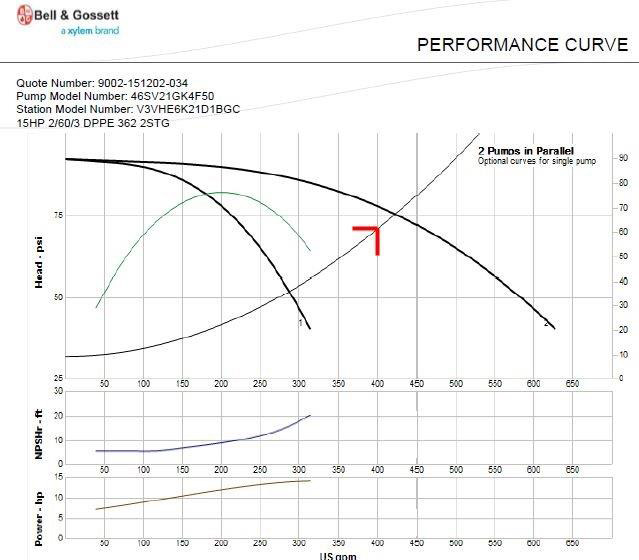
Bell and Gossett Example Curves
Below are two example curves from the Bell and Gossett Technoforce sizing program.
In the real world, the suction pressure normally varies and does not stay at the minimum very much during the year. Again, looking at the example from the previous MMM of December 14, we have a maximum suction pressure of 61 PSIG.
In this example, looking at operating costs, we’ll use a suction pressure of 32 PSIG for 30% of the year, 61 PSIG for 30% of the year, and 47 PSIG for 40% of the year. This lets us include that important variable suction pressure in the calculations.
In systems with a great deal of lift or elevation and little friction loss, varying suction pressure is the reason the speed changes the most.
77 PSIG − 32 PSIG = 45 PSIG for 40% of the year
77 PSIG − 47 PSIG = 30 PSIG for 30% of the year
77 PSIG − 61 PSIG = 16 PSIG for 30% of the year
Our control head will change every time the suction pressure changes. As the suction pressure rises, the speed can be reduced and we save energy.
So we have load profiles, we have design capacities, and we have control heads. Next week we’ll compare the operating costs of these systems with various pump combinations to determine what the best recommendation is for the client.
R. L. Deppmann is holding seminars on this subject in our territory in 2016. Visit our Education page for more information.