 We understand that the best way to determine the flow rate of an operating pump is the proper readout of gauges attached to the pump suction and discharge. Sometimes the gauges are not available, damaged, or questionable. Other times the pump impeller curve is so flat in the expected operating range that an additional input would be helpful. Service contractors and owners may turn to the motor AMP readings as an indicator of the pump operation. How do we use these readings? That is the subject of today’s R. L. Deppmann Monday Morning Minutes.
Pump Curves and Horsepower Curves
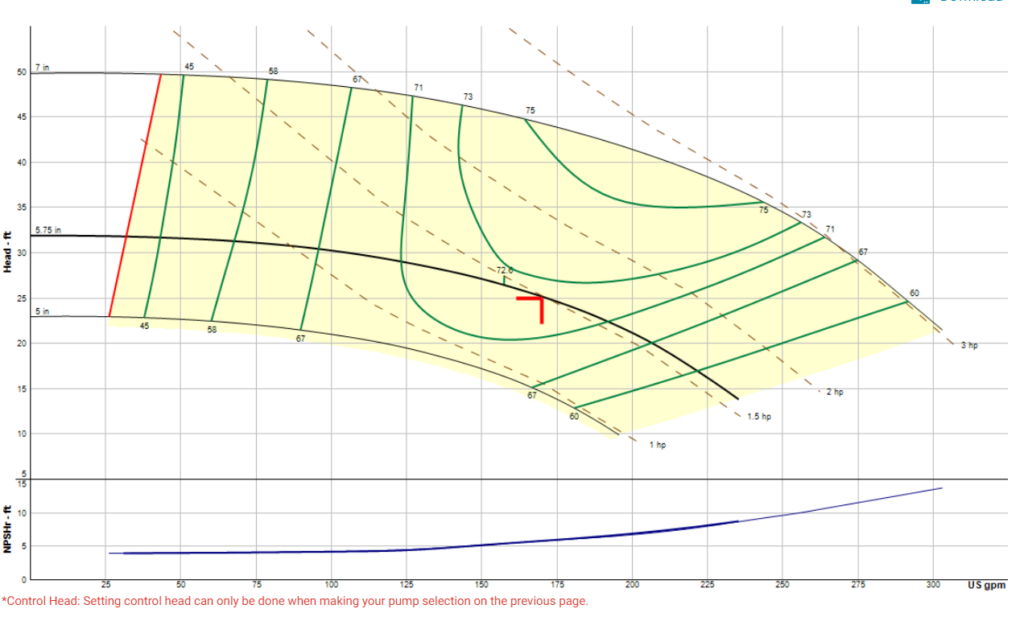
Here is an example of a pump curve of a primary heating pump at a school we recently visited. The design capacity was 170 GPM at 25 feet of head. The B&G pump had a 5-3/4” impeller. The pressure differential pressure gauge readings were inconclusive. There was air present in the system which made the needle bounce too much. The gauges themselves had too large a range at the low pressures we were reading. The readings we saw could indicate a flow rate between 125 GPM and 200 GPM. We needed another means to check the flow.
The curve indicates brake horsepower or BHP. At 125 GPM, the BHP is about 1.3, and at 200 GPM we see 1.55 BHP. Will the AMP draw to the motor show the difference? Read more about BHP at Centrifugal Pumps and Pump Curves for HVAC and Plumbing Systems and Balancing & Trimming Hydronic Constant Speed Pumps.
Amp Draw to Horsepower Conversion
What is the relationship between the input HP (IHP) to a motor and the amp draw? Start with the KW formula for single-phase motors.
WATTS=AMPS x VOLTS x EFF x PF x √PHASES
KW=WATTS/1000
HP=KW x 1.34
Where the motor efficiency and power factor are at the percent of full load amps. The square root of the number of phases is used for three-phase motors. In a single-phase motor, the square root of 1 phase is just 1. In a three-phase motor, the square root of 3 is 1.732.
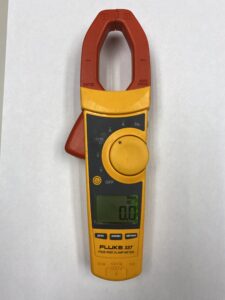
The amp draw must be made with an RMS or root mean square meter. An averaging meter will give you too much error. Most clamp-on amp probes are RMS meters. The Danfoss VLT variable frequency drive shows amps, and it is an RMS reading.
The voltage should be the actual voltage read on the jobsite. The motor efficiency and power factor should be at the percent of full load for the motor. This is a piece of information that is not always available so we have to use some estimates.
Premium Efficiency Motor Efficiency and Power Factor
Motor full load efficiency, power factor, and amps are normally published or are on the nameplate. What do we do when our readings are less than full load? The US Department of Energy’s “Premium efficiency motor selection and application guide” has some handy charts in chapter four. The guide applies to three-phase motors 1 HP and over. It does not include single-phase motors, but we can use them as I will show in a later example.
Figure 4-4 shows how the average efficiency changes with load.
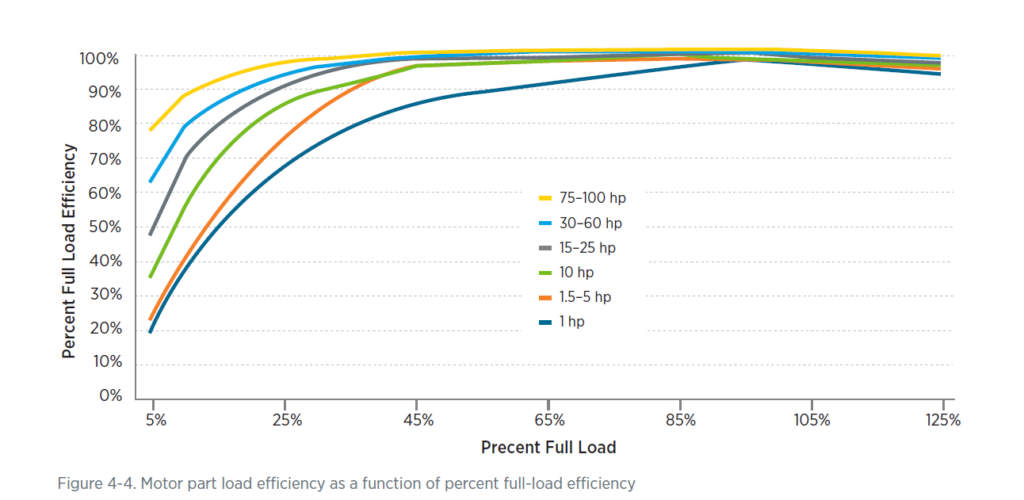
From chapter 4 of the US Department of Energy’s Premium Efficiency Motor Selection and Application Guide
It is clear that if we are over 1.5 HP, the efficiency is relatively constant between 45% and 100% of full load. Below 45% the efficiency drops off as shown. We could use this chart to get close if the actual data is not available.
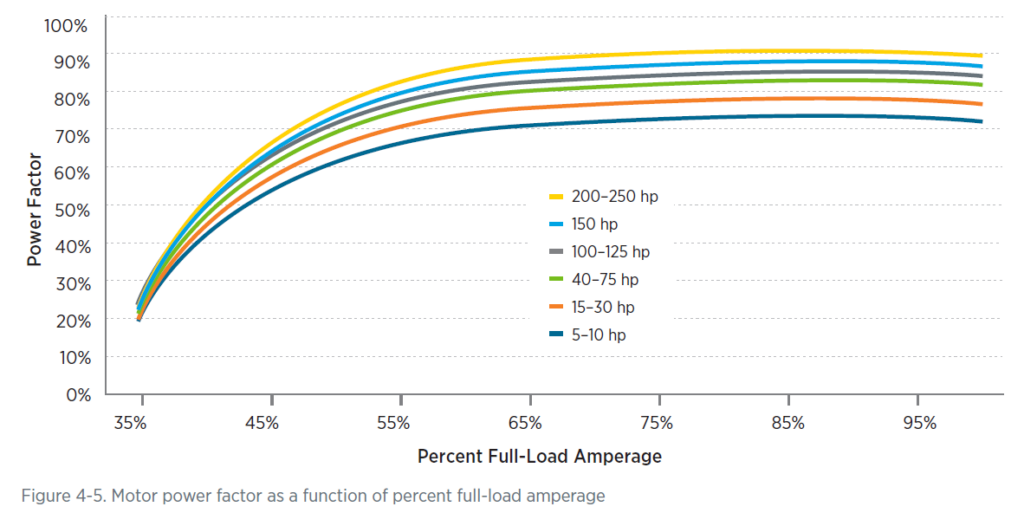
Figure 4-5 has a similar chart for power factor.
Here we see the power factor is about the same from 60% to 100%. Now we will use these in an example.
Example: Estimated Flow Rate from an AMP Reading
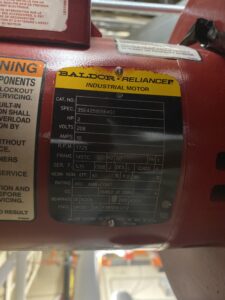
The nameplate above was taken from a single-phase motor on the pump with the curve shown earlier in the blog. It is a 208-volt single-phase motor with a full load amp (FLA) of 10 and 80% nominal NEMA efficiency and 86% power factor.
We used an RMS clamp on the amp probe and read 7.9 amps at 210 volts. Let’s see what the horsepower looks like. We will need the efficiency and power factor at the 8.9 amps.
Take the percentage of the read amps to FLA. 7.9/10 = 79%. The graphs shown above are published for the NEMA premium efficiency three-phase motors. This motor is single phase and not covered by that standard but the chart percentage will be close enough for this exercise. We see at 79% that the EFF and PF are close to the nameplate so we will use the nameplate data.
HP=(1.34 x AMPS x VOLTS x EFF x PF x PHASES)/1000
=(1.34 x 7.9 x 210 x .80 x .86 x 1)/1000
HP=1.529
Based on this reading, it appears for the 5-3/4” impeller curve that the flow rate is about 185 to 195 GPM. A much tighter estimate of flow rate than we could get with the oversized pressure gauges with bouncing needles.
Motor Efficiency Before Premium Efficiency Standards
There are still a large number of older pumps and motors in service in mechanical equipment rooms. What happens if your pump and motor are very old? It is always preferred to have the correct pump curve in hand. Unfortunately, the pump nameplate is often missing after decades of service. If the pump is a Bell and Gossett brand, your local representative will assist you in determining the pump model. Here is a R. L. Deppmann blog to assist you in gathering needed information.
Both pump and motor efficiencies are constantly improving. R. L. Deppmann’s Bell & Gossett 1510 Pump Model Numbers: Field Estimation of Flow Rate blog shows the difference in pump efficiencies in three versions of a base-mounted pump over a 60-year life.
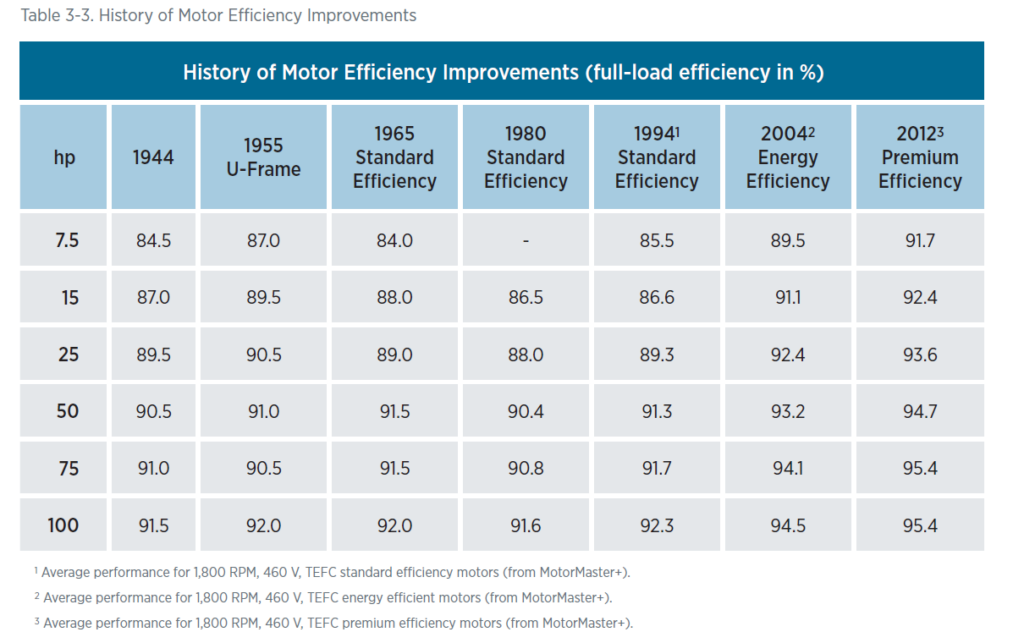
If the motor is older than the current premium efficiency standard, there is a chart 3-3 in the publication mentioned above that may help.
This table will get you closer than a guess if you have a very old motor. Estimating with so many assumptions may make the error greater. Contacting the manufacturer of the motor may help.
I hope this R. L. Deppmann Monday Morning Minutes will help you use both gauges and amp readings to determine the flow rate from your pump.

