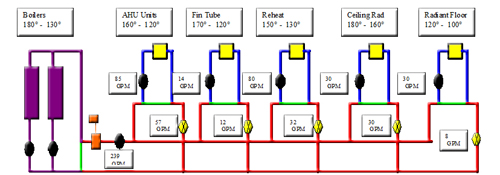
Last week, we created a chart showing the flow rates and temperatures in an example system so we could maximize the delta T at the boilers. Today we will show how this system example looks when laid out as a primary secondary tertiary system. Please note we are not showing the complete detail of the system trim which we will detail in a later article.
Here is our example:
Here is a P-S-T layout:
In the next two articles we will apply Laars and Aerco boilers to this system example.
High Delta T Hydronic Heating Systems Series:
- Part 1: Primary Secondary Tertiary Systems for High Delta T Hydronic Heating Systems
- Part 2: How to Increase the Delta T in Hydronic System Design
- Part 3: Increasing Delta T and Lowering Water Temperature in Hydronic Heating Systems
- Part 4: Maximizing Delta T in Boilers
Thank you for using products sold by R. L. Deppmann Company in Michigan and Ohio!


