Printer Friendly (PDF)
What is psychrometrics? It’s a big and intimidating word to be sure and the common definition, the study of the physical and thermodynamic properties of gas-vapor mixtures, doesn’t make it much less so. But we’re going to break it down for you in a way that is both simple and practical with regard to HVAC and humidification.
We experience the principles of psychrometry every day. We know, for instance, that on a very hot and humid day with little or no breeze, we’re going to feel pretty miserable. We’ll not only get hot and sweaty, we’ll stay hot and sweaty. Conversely, in winter we may start to feel parched sitting inside a heated space when the air is crisp and cold outside. The environment not only impacts the way we feel but, the things around us do. In winter, wood floors can actually shrink to the point that you may see little cracks between the planks all because the dry air is literally sucking the moisture out of them. It’s all psychrometrics. And it’s all about the relative interactions of water, air, and temperature.
Psychrometrics Shows How Cold Air Holds Less Moisture
Let’s start with the most basic and perhaps the most important psychrometric principle of all: Cold air holds less moisture than warm air. Invariably, as the dry bulb temperature drops, so does the amount of moisture the air can hold. And it doesn’t drop in random amounts – it drops in very specific amounts, depending on the dry bulb temperature and the wet bulb temperature.
We can even predict these values. There’s a bit a math involved, but fortunately we’re spared the legwork thanks to the invention of the psychrometric chart. In fact, today, engineers don’t even have to use psychrometric charts since all that information has been integrated into common software programs. That said, we’re going to invoke the dreaded psychrometric chart to help us understand the interactions of air, moisture, and temperature. Once we understand these interactions we’ll begin to understand how one or more of them can be mechanically manipulated to achieve the desired space conditions.
The terms “dry bulb temperature” and “wet bulb temperature” are used in the chart. Dry bulb temperature is what we hear on the weather report or when we look at a thermometer. Wet bulb temperature is a little harder to explain. If you’re standing outside and it’s a nice sunny day and 95°F, you’re hot. If you jump into a swimming pool and then hop right out and stand there, you feel cooler as the water evaporates on your skin. That cooler feeling is similar to the wet bulb temperature. As the water evaporates, you feel cooler. The wet bulb temperature is the temperature of a thermometer with a damp cloth wrapped around it.
Let’s begin with an example using a design dry bulb temperature of 95db and 78wb.
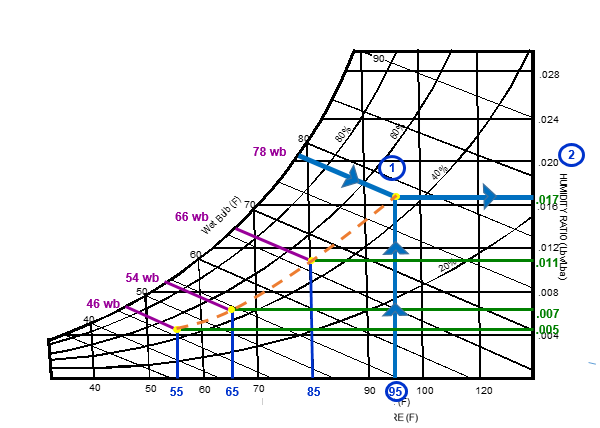
We’ve plotted these and other values on the psychrometric chart shown above. The dry bulb temperatures are on the horizontal axis and the wet bulb temperatures are on the far left curve. Once we find the point of intersection of these two values, we can use it to define other values, including:
- Point one is the relative humidity. This is found at the intersection of our db/wb points. The curved lines represent the relative humidity, so in this case we know that it is somewhere between 40 and 60%. We can visually estimate it to be approximately 47%.
- Point two is the humidity ratio (Lbs. of water/Lbs. of air) is shown on the right vertical axis. Thus, at 95db and 78wb, the humidity ratio is approximately .017Lbw/Lba, the ratio is .017 pound of water in one pound of air. But instead of expressing this as a fraction, we usually express this value in grains. Since there are approximately 7000 grains of moisture/pound of water, .017Lbw/Lba is equivalent to approximately 119 grains (7000 X .017 = 119).
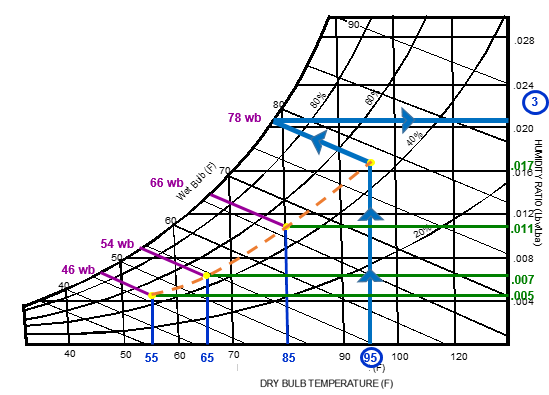
The chart below shows another important point: the maximum amount of water the air can hold at 100% RH. Move up from 95 dry bulb to 47 % RH, then follow the 78°F wb line to 100% RH, then move horizontally to the right to read the Humidity ratio.
3. The maximum amount of water at 100% RH is .021 lb water/pound of air or 147 grains.
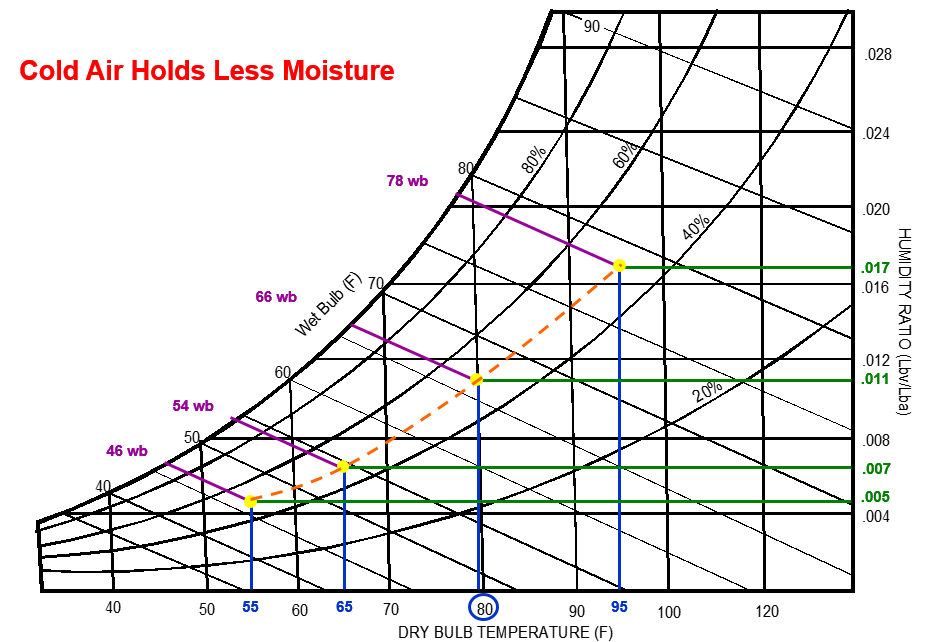
Psychrometrics Shows How Moisture Content Is Affected by Lower Temperatures
What happens when the RH remains the same and the temperature drops? What if we cool the air to 80, 60, and even 55db? How does that impact the moisture in the air, assuming the RH remains at 47%? As you can see, the humidity ratio begins to drop the cooler we get on the dry bulb axis. Once again, cold air holds less moisture!
Looking at the same chart, you can also determine the MAXIMUM amount of moisture the air can hold at any of the given conditions defined by the green lines and yellow dots. We’ve entered these values into the chart below – and we’ve converted the Lbw/Lba values to grains. Notice that we’ve included a row that defines the maximum humidity ratio values for each of these wb/db conditions and included the values that represent the maximum amount of grains of moisture that can be added before the air reaches the point of saturation.
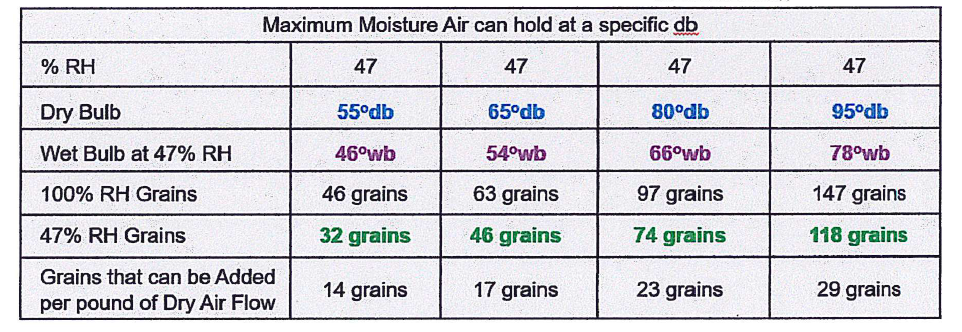
Why is this important? Because it keeps us within the limits of suitable design. We may need to add moisture to the outdoor air, but we don’t want to make it rain in the duct.
As mechanical designers, we manipulate the moisture and/or air flow to keep space conditions within a certain range, but psychrometrics tell us how careful we have to be.
For example, what happens when you bring 10db outdoor air at 60% RH into a building and heat it up to 70 degrees? You drastically reduce the relative humidity! At 10 degrees, 6 grains of moisture has 60% relative humidity. But at 70 degrees, 6 grains of moisture translates into an RH of only 4%, which is far too dry for human comfort!
It’s the relationship between these values that we want you to grasp – even if you never become super-handy with a psychrometric chart. That said, if you want to master psychrometrics without the aid of modern software, we recommend these online resources and videos:
Avoid wet ducts by ensuring humidification absorption – Dristeem
Adiabatic basics: Types, applications and benefits of adiabatic humidification
HVAC Made Easy – Overview of Psychrometrics
Psychrometric Charts – How to Draw (video)
Psychrometric Charts Simplified (video)
How To Read a Psychrometric Chart (video)